Reducing Latencies: Cutting Database Load by 72%
optimization
database
postgresql
TL;DR
Optimizing database performance by adding indexes, extending materialized view refresh rates, and caching frequently accessed queries resulted in a 72% increase in efficiency and reduced costs. These changes collectively decreased database load and improved user experience.
Introduction
As NodeFlair grows and we’re seeing a 30% month-over-month increase in user sessions, we’re running into performance issues that are affecting the user experience.
Join me as I dive into the problem and show you how I fixed it with just three simple tweaks.
🔎 Investigation
| Database connections remains the same | 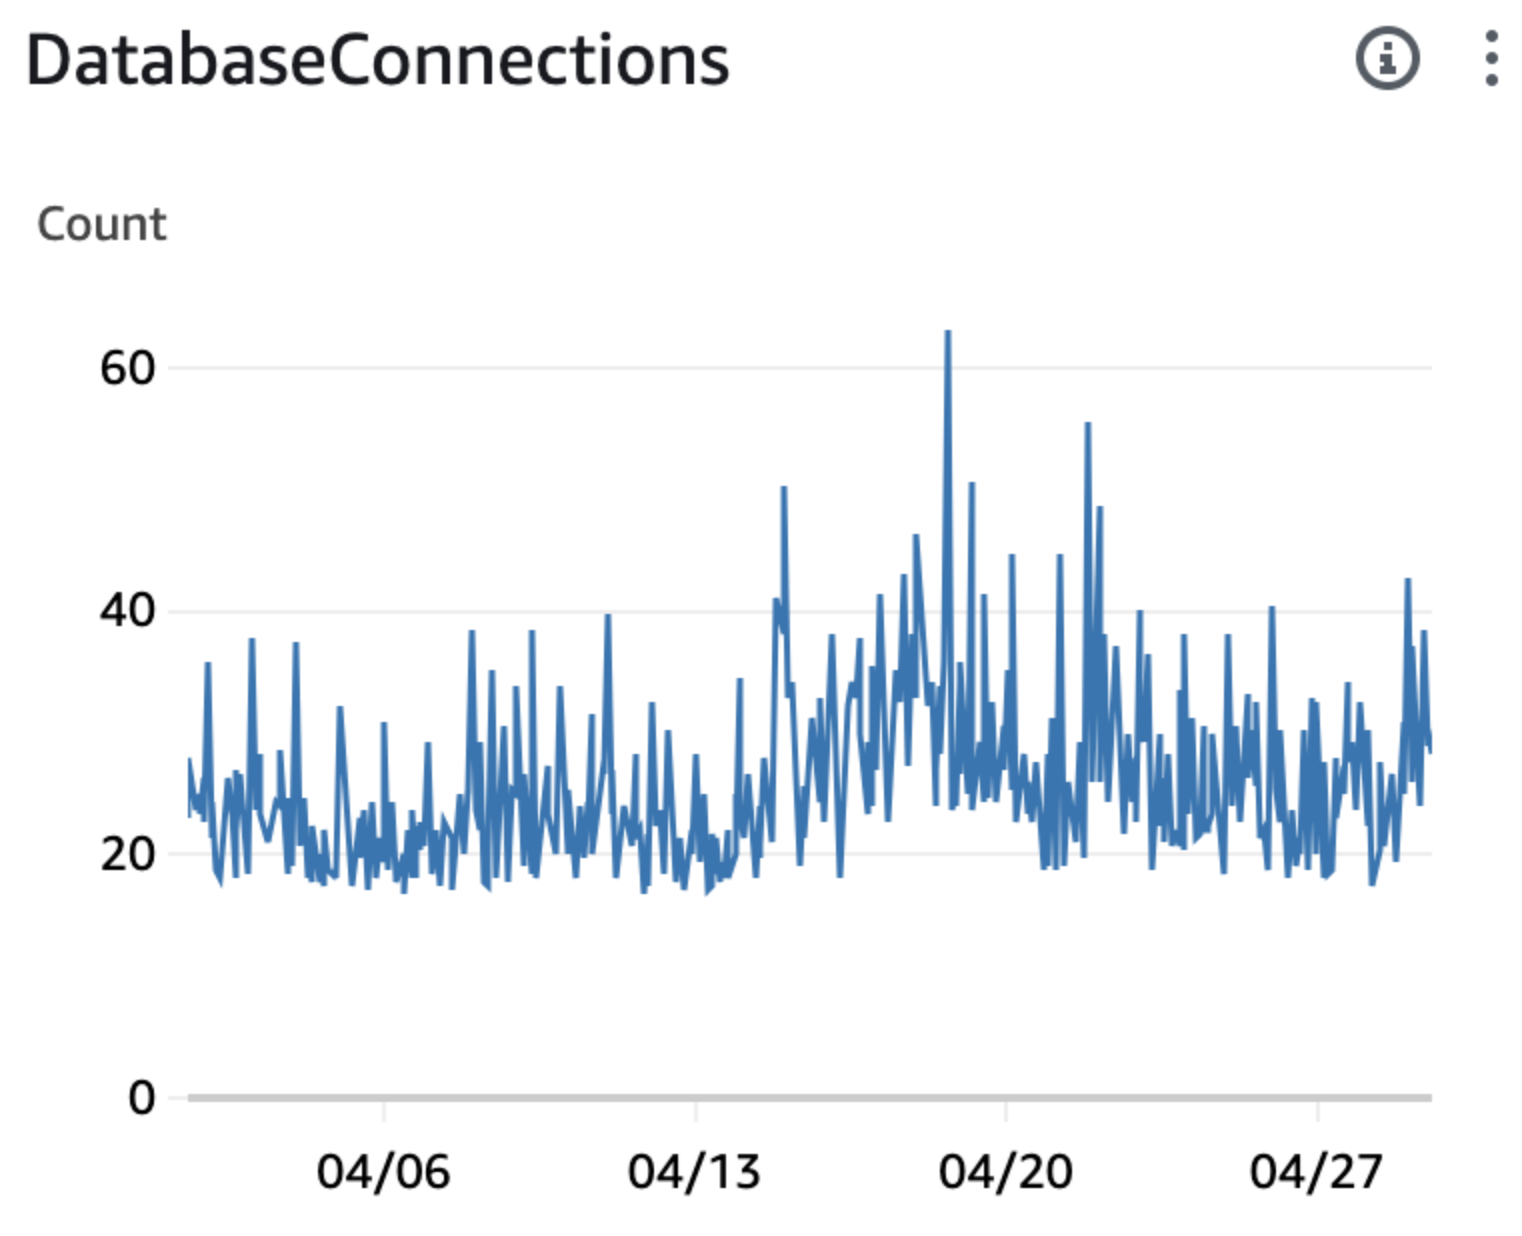 |
| Freeable memory (RAM) remains the same | 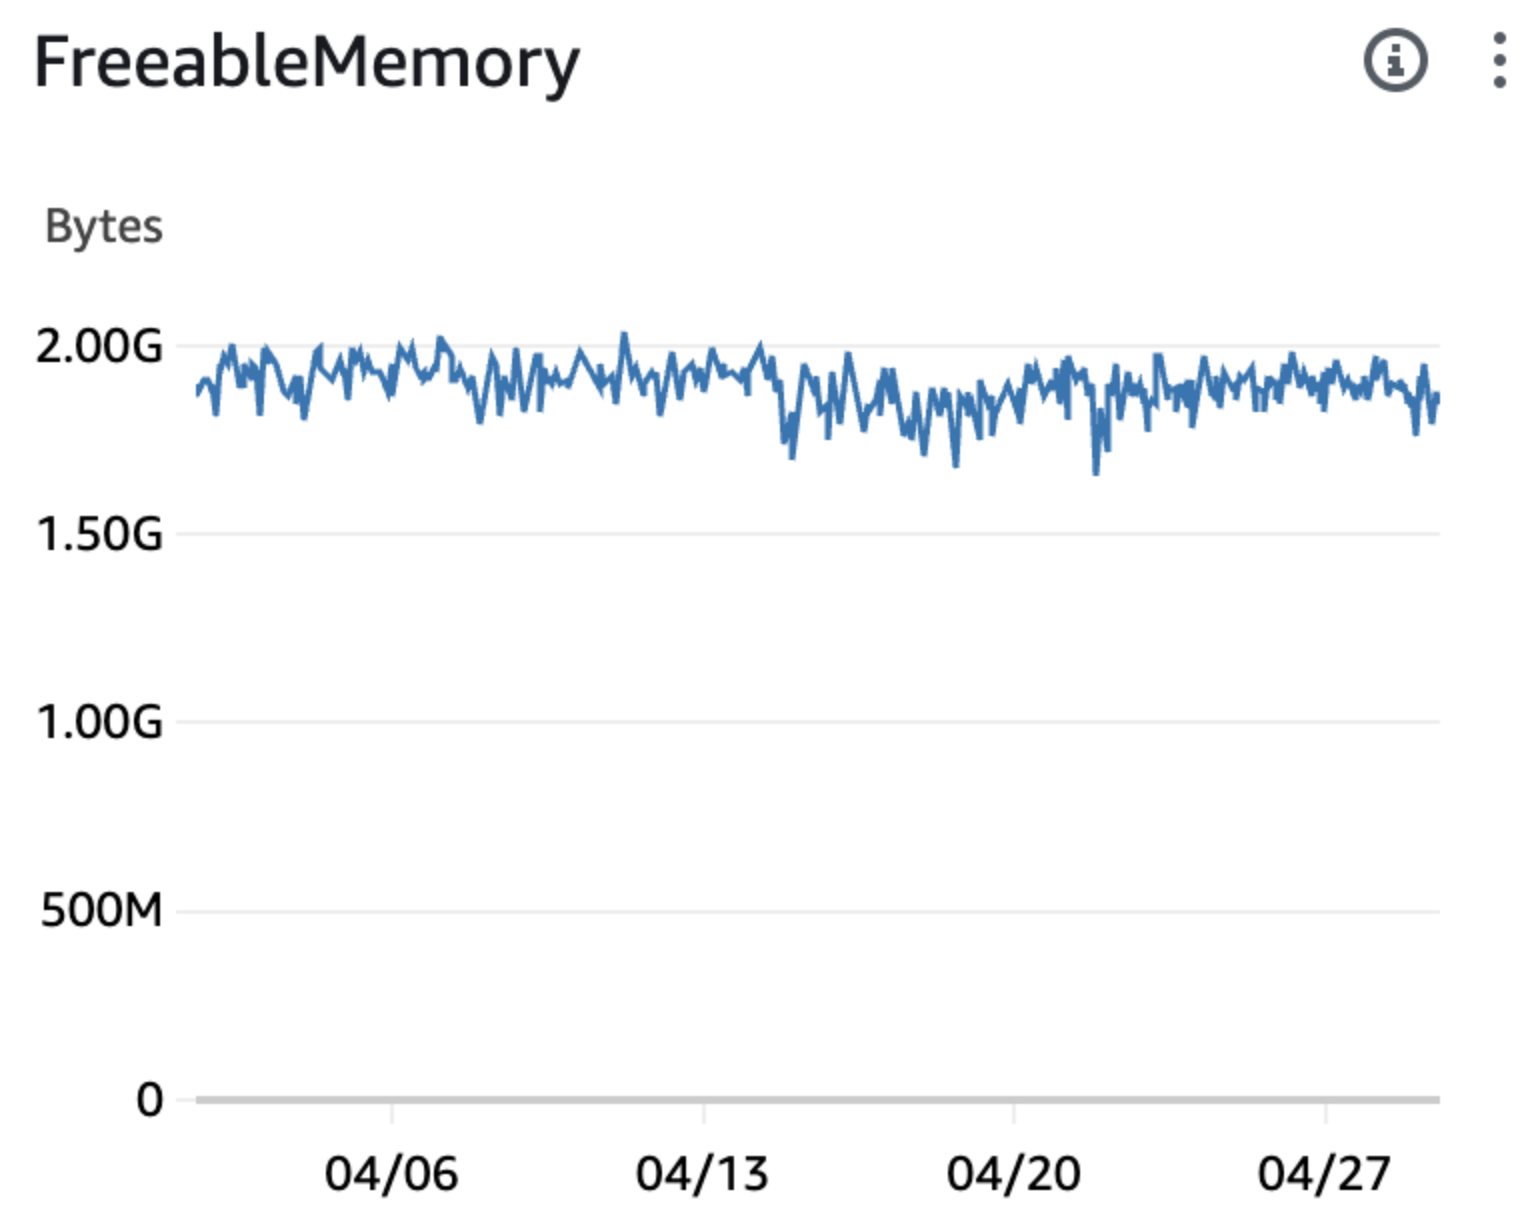 |
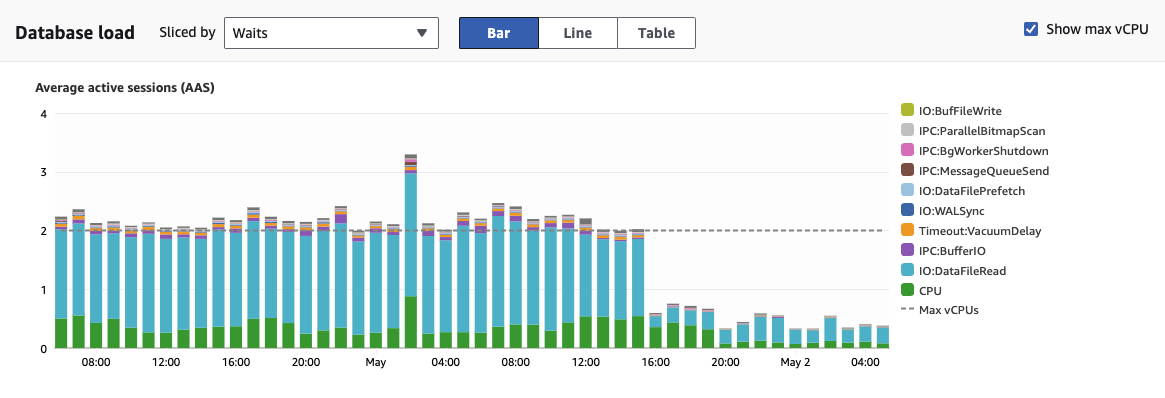
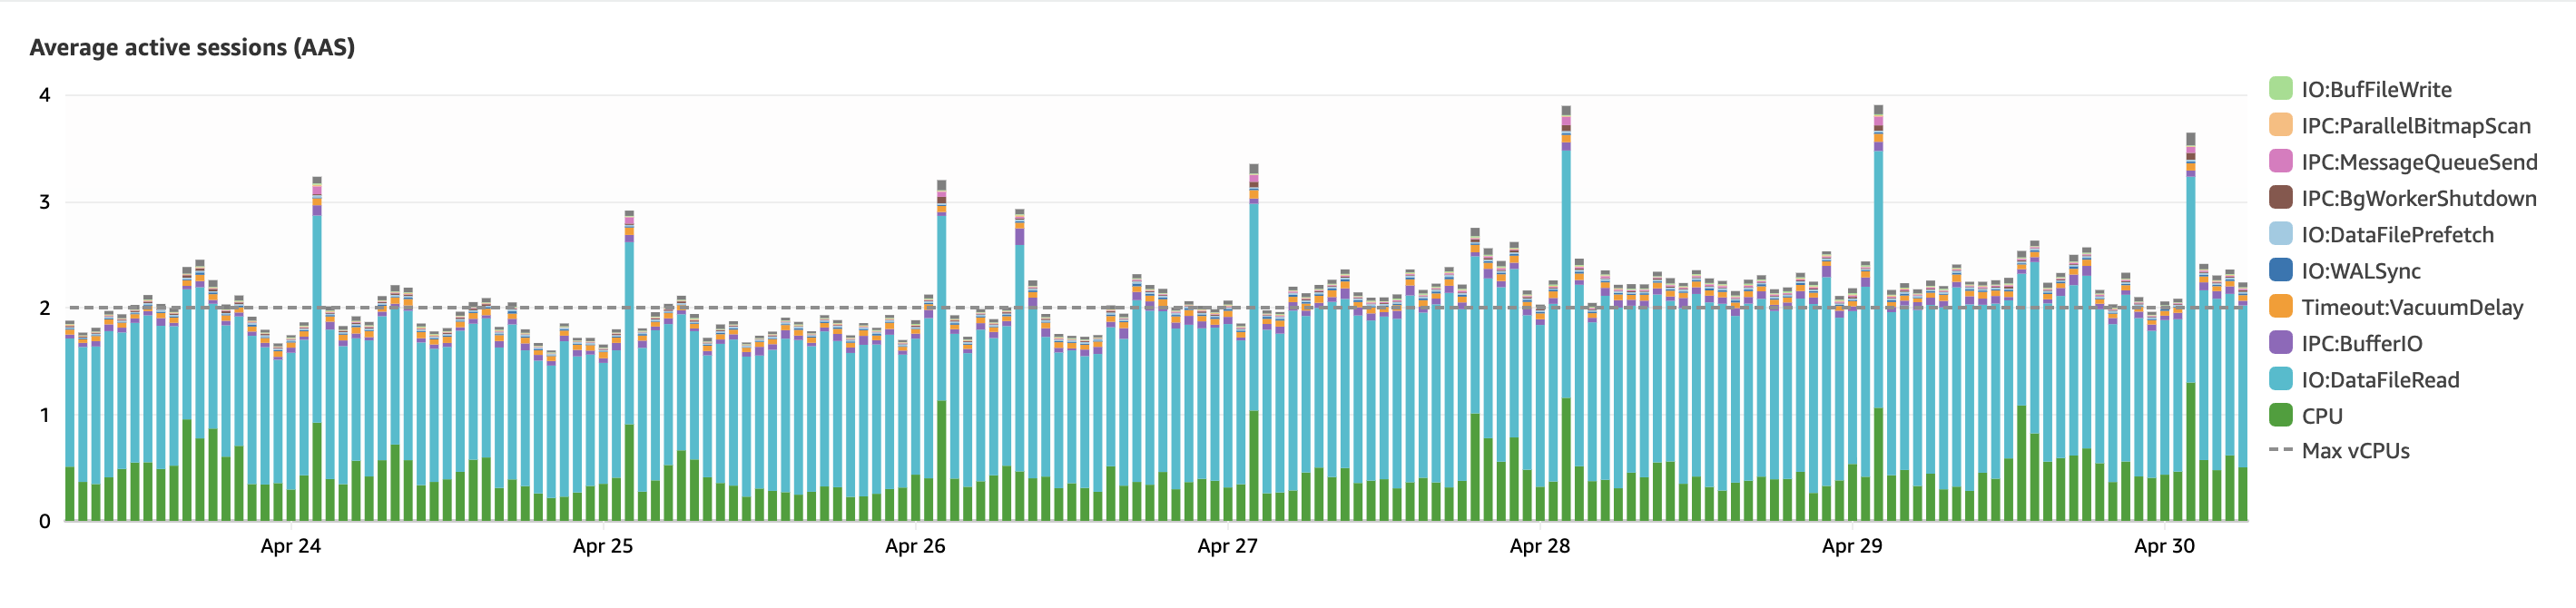
| DB Load is increasing! | 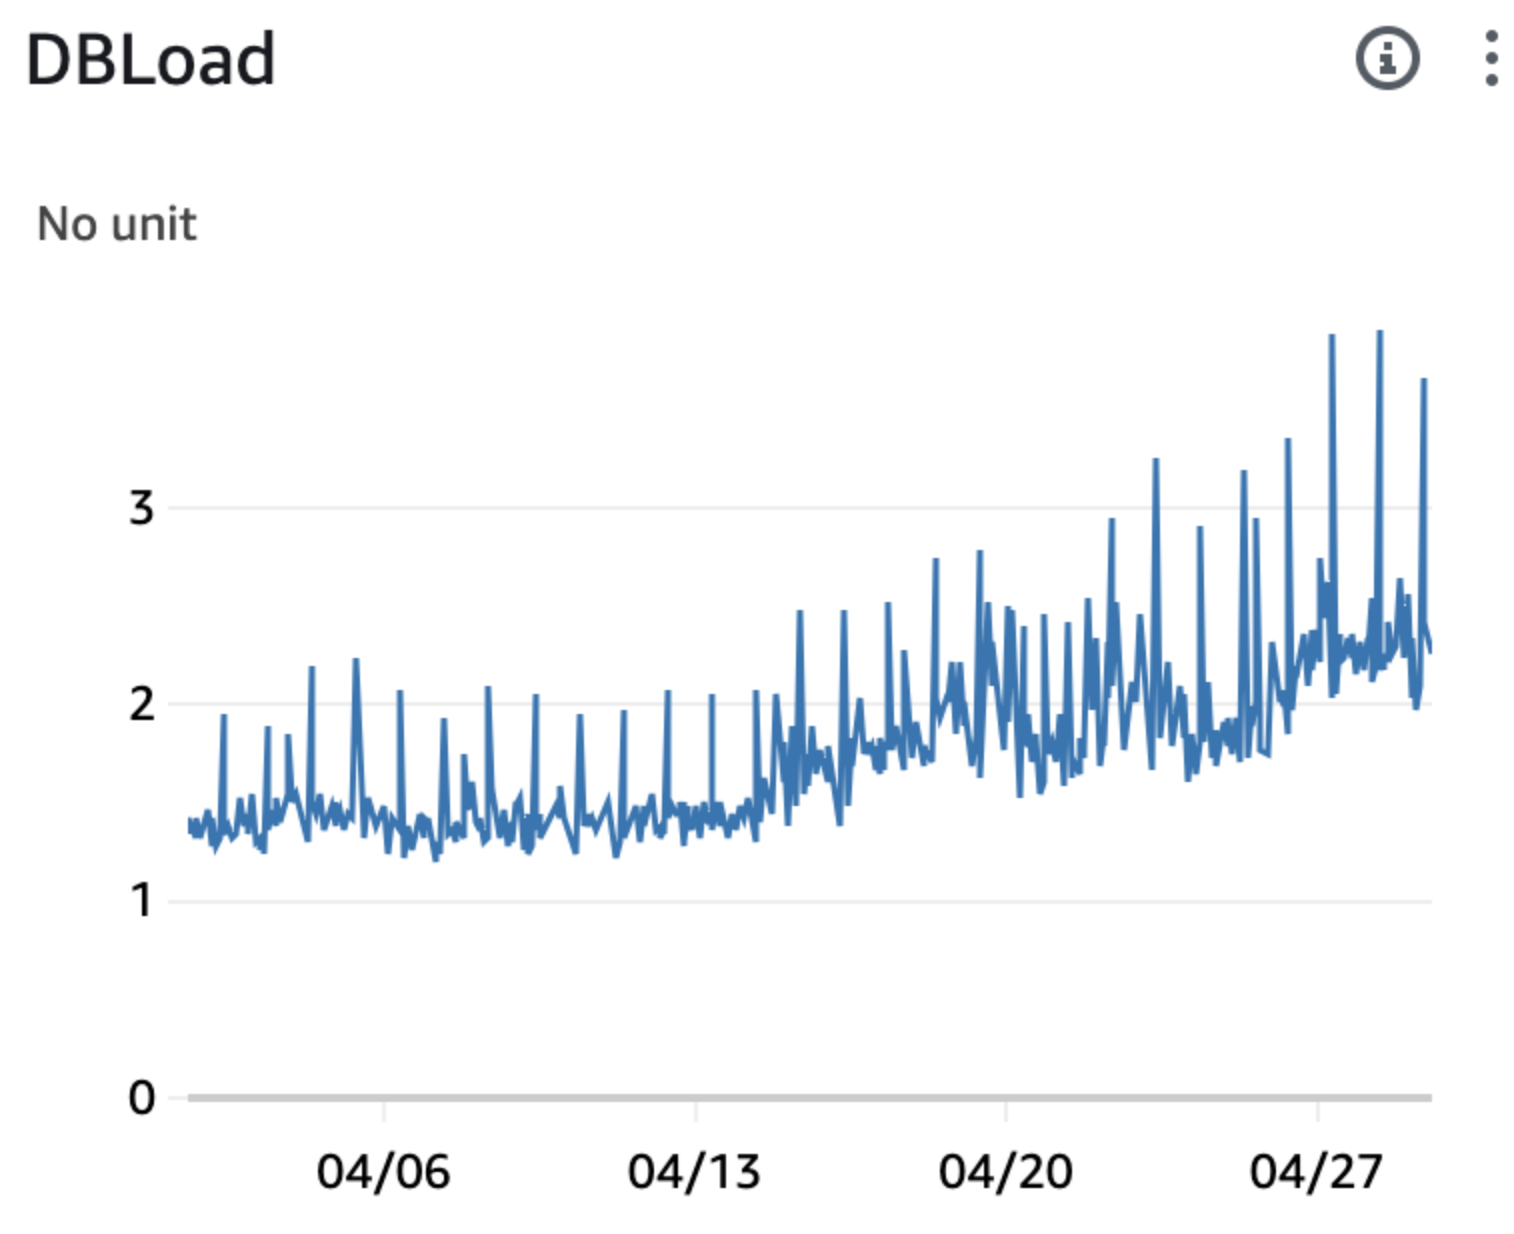 |
When we’re using the db.t4g.medium model with its 2 vCPUs, we’ve got to keep the database load under control. If it goes over that limit, performance takes a hit. So, let’s dive deep and pinpoint which queries are pushing the load up.
Here’s how I reduced the DB Load
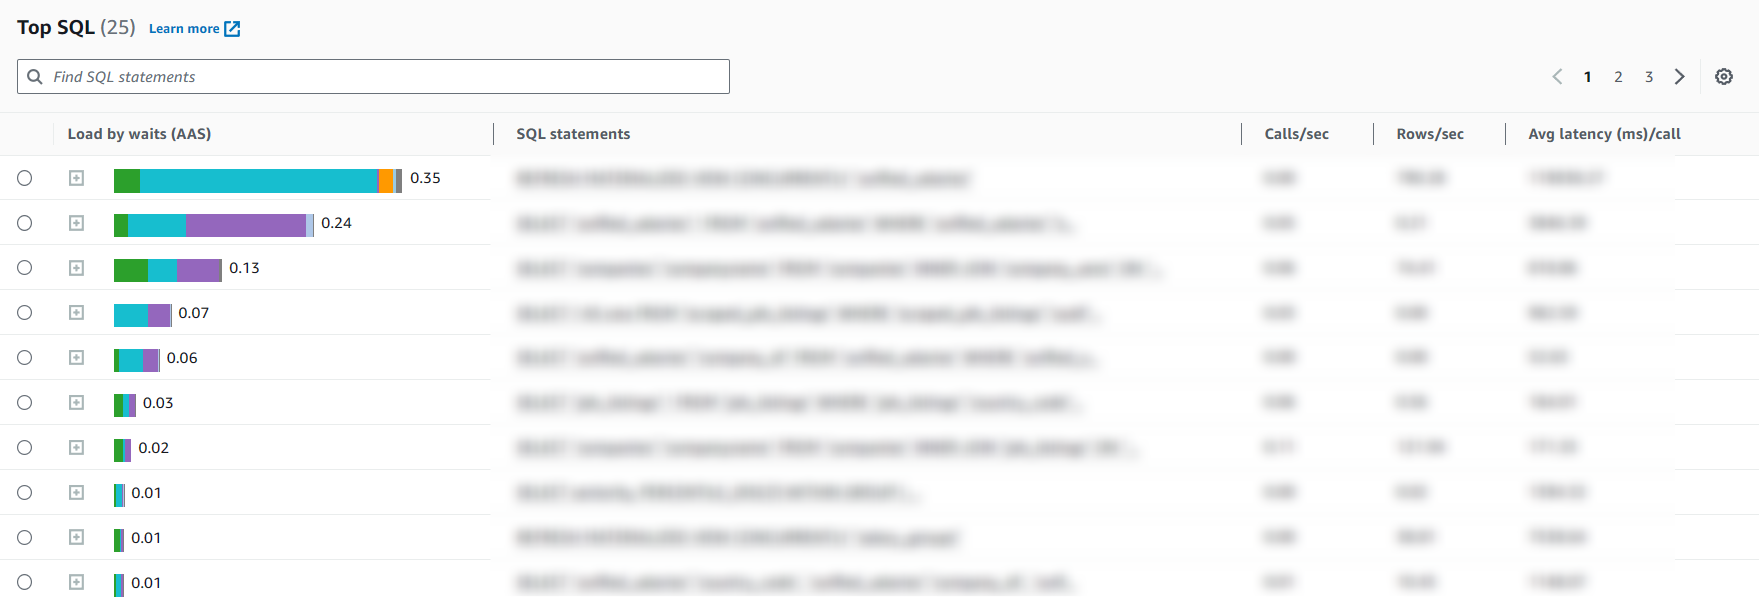
One thing I love about Amazon RDS is that it includes free Performance Insights, which allows us to delve into the top SQL queries contributing to the database load.
After experimenting with it a bit, I now have a good idea of some areas where I can optimize.
1️⃣ Adding Database Indexes
We had a query relying on a few columns for joins and ordering—columns that weren’t indexed. Adding those indexes cut the database load by 10% (from 2.2 to 2.0). It’s a small tweak, but hey, it’s a solid win right out of the gate!
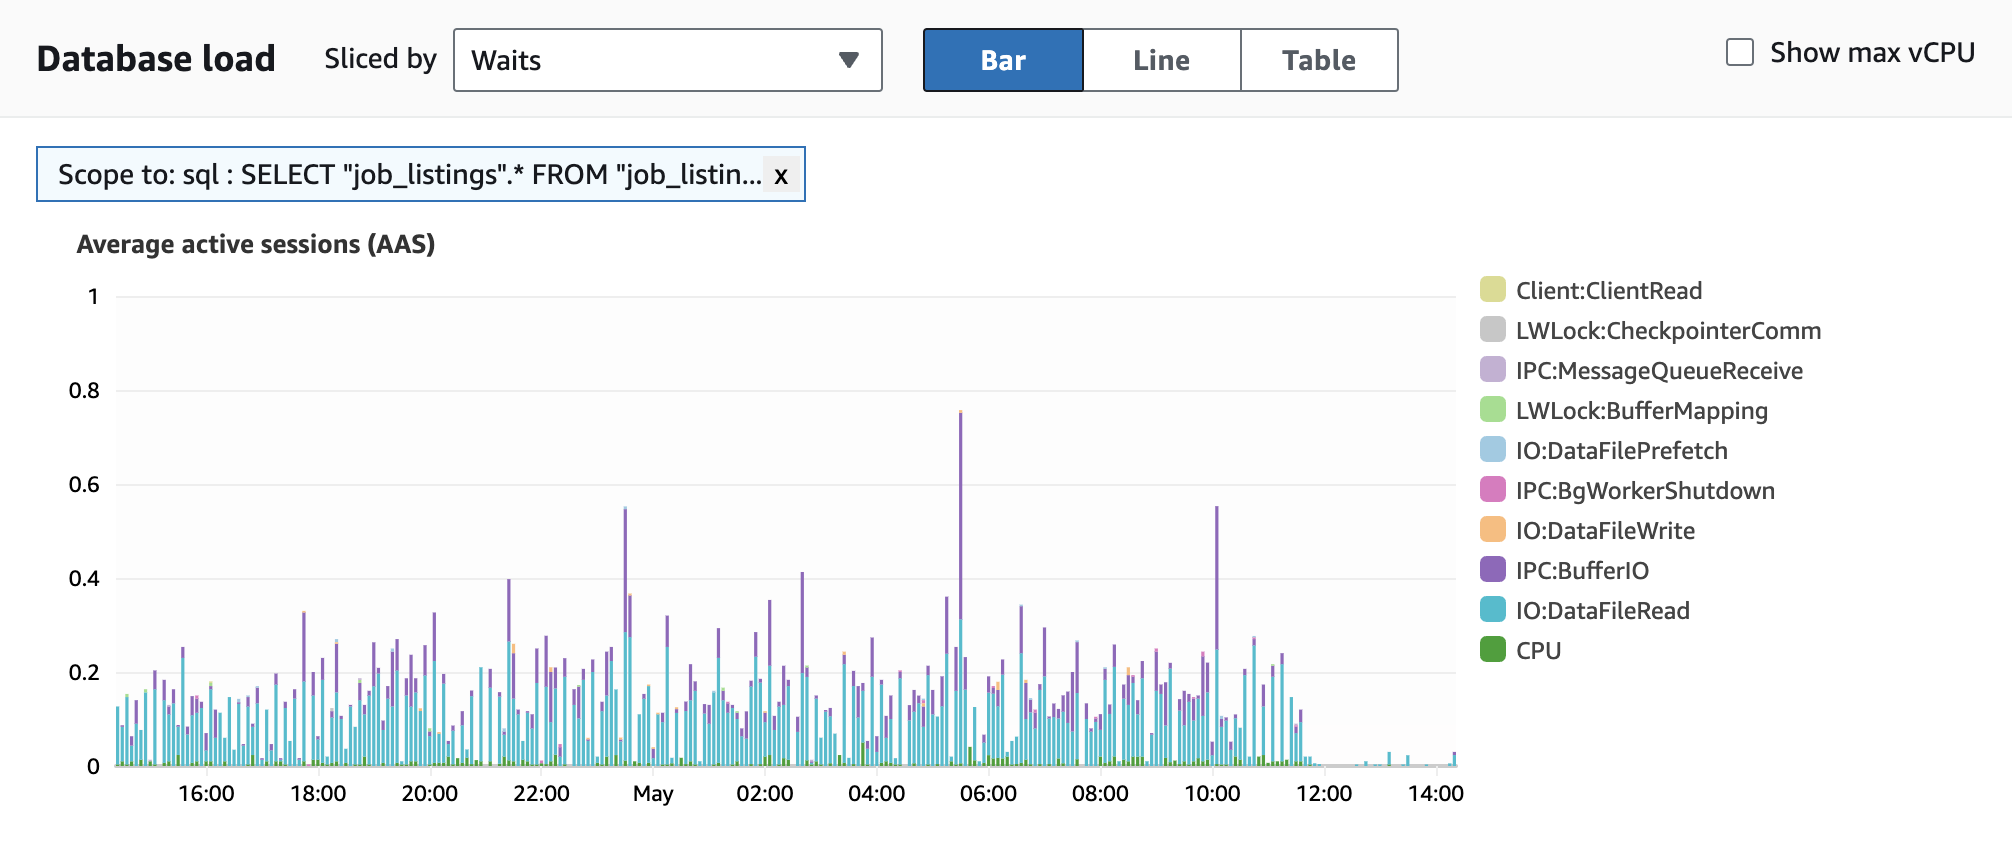
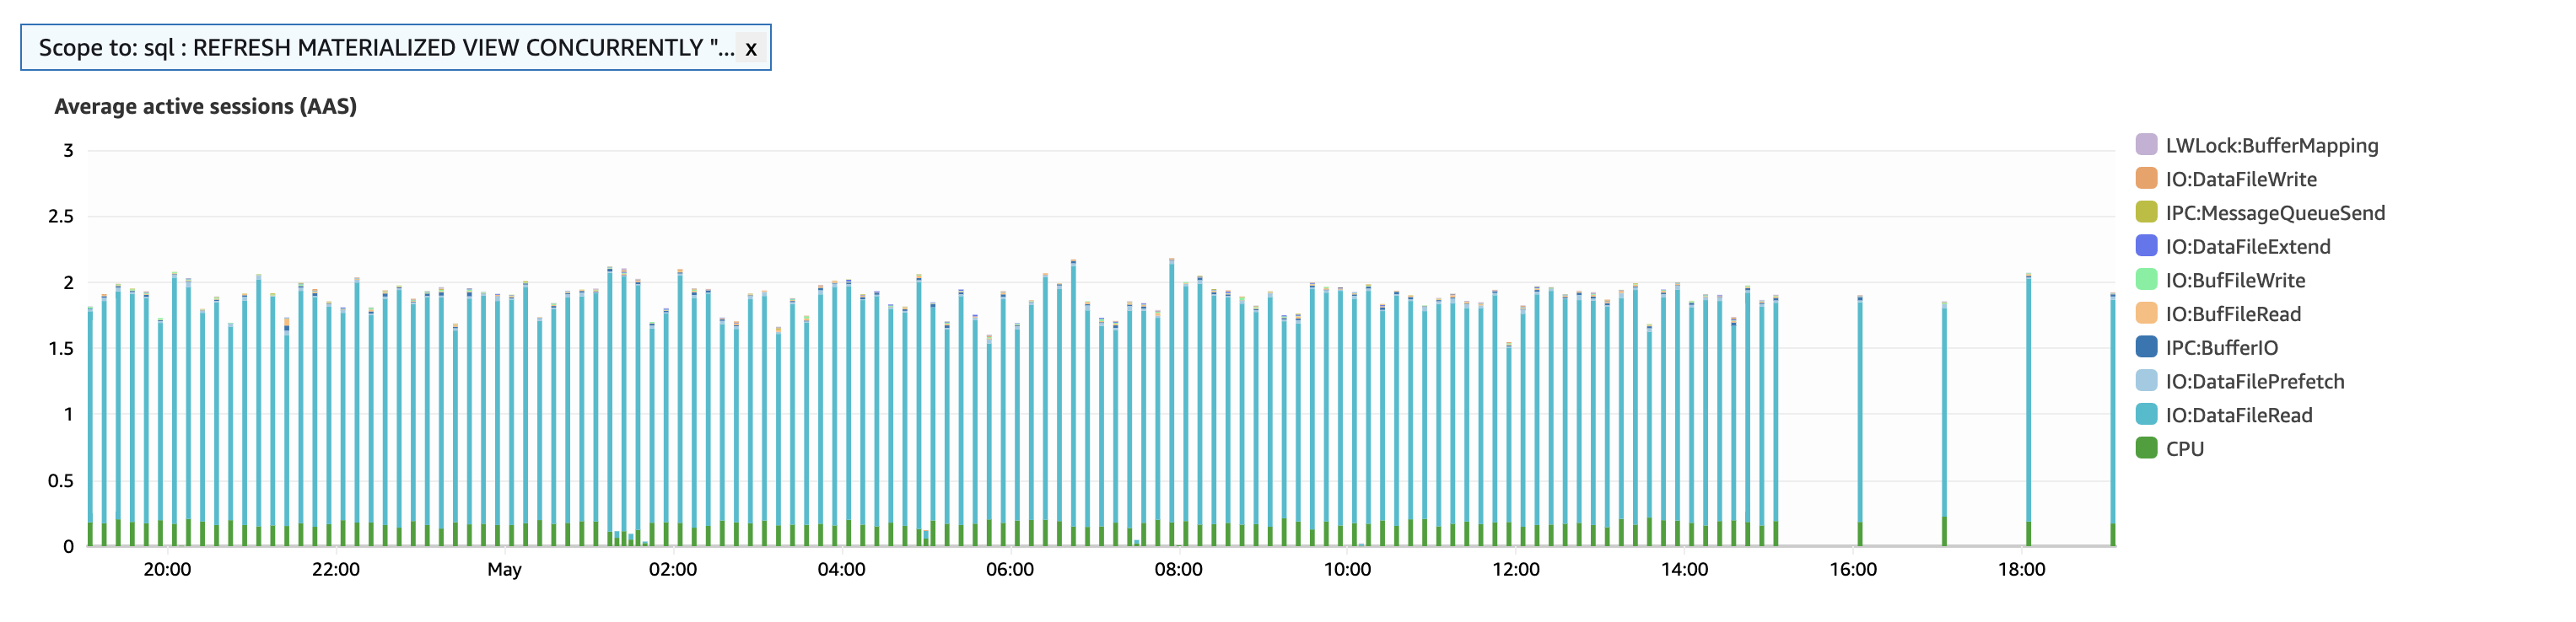
2️⃣ Reducing Frequecy of Materialized View Refresh
NodeFlair’s salary data comes from a bunch of sources, and leveraging a materialized view was a game changer for speed. It did wonders by pre-computing the data.
But here’s the kicker: as our data points grew to millions, the refresh process started taking up to 6 minutes. That’s bonkers, especially since we’re refreshing every 10 minutes!
So, I had to ask—do we really need this refresh frenzy every 10 minutes? Sure, almost-real-time data sounds great, but the reality is, the data doesn’t shift that much every 10 minutes. Stretching the refresh to 60 minutes doesn’t really hurt the user experience.
Here’s the bonus: by slowing down the refresh rate, we’re also cutting down on query time and database load when not refreshing.
This is because refreshing involves:
- Locking tables, which blocks other queries and creates wait times.
- Heavy I/O operations, which lead to disk contention and slower performance.
Overall, this tweak dropped our database load from 2.0 to 0.7!
It’s a solid fix and we can definitely call it quit, but since we’re all about optimization, why not dig deeper and find more ways to scale better for the future?
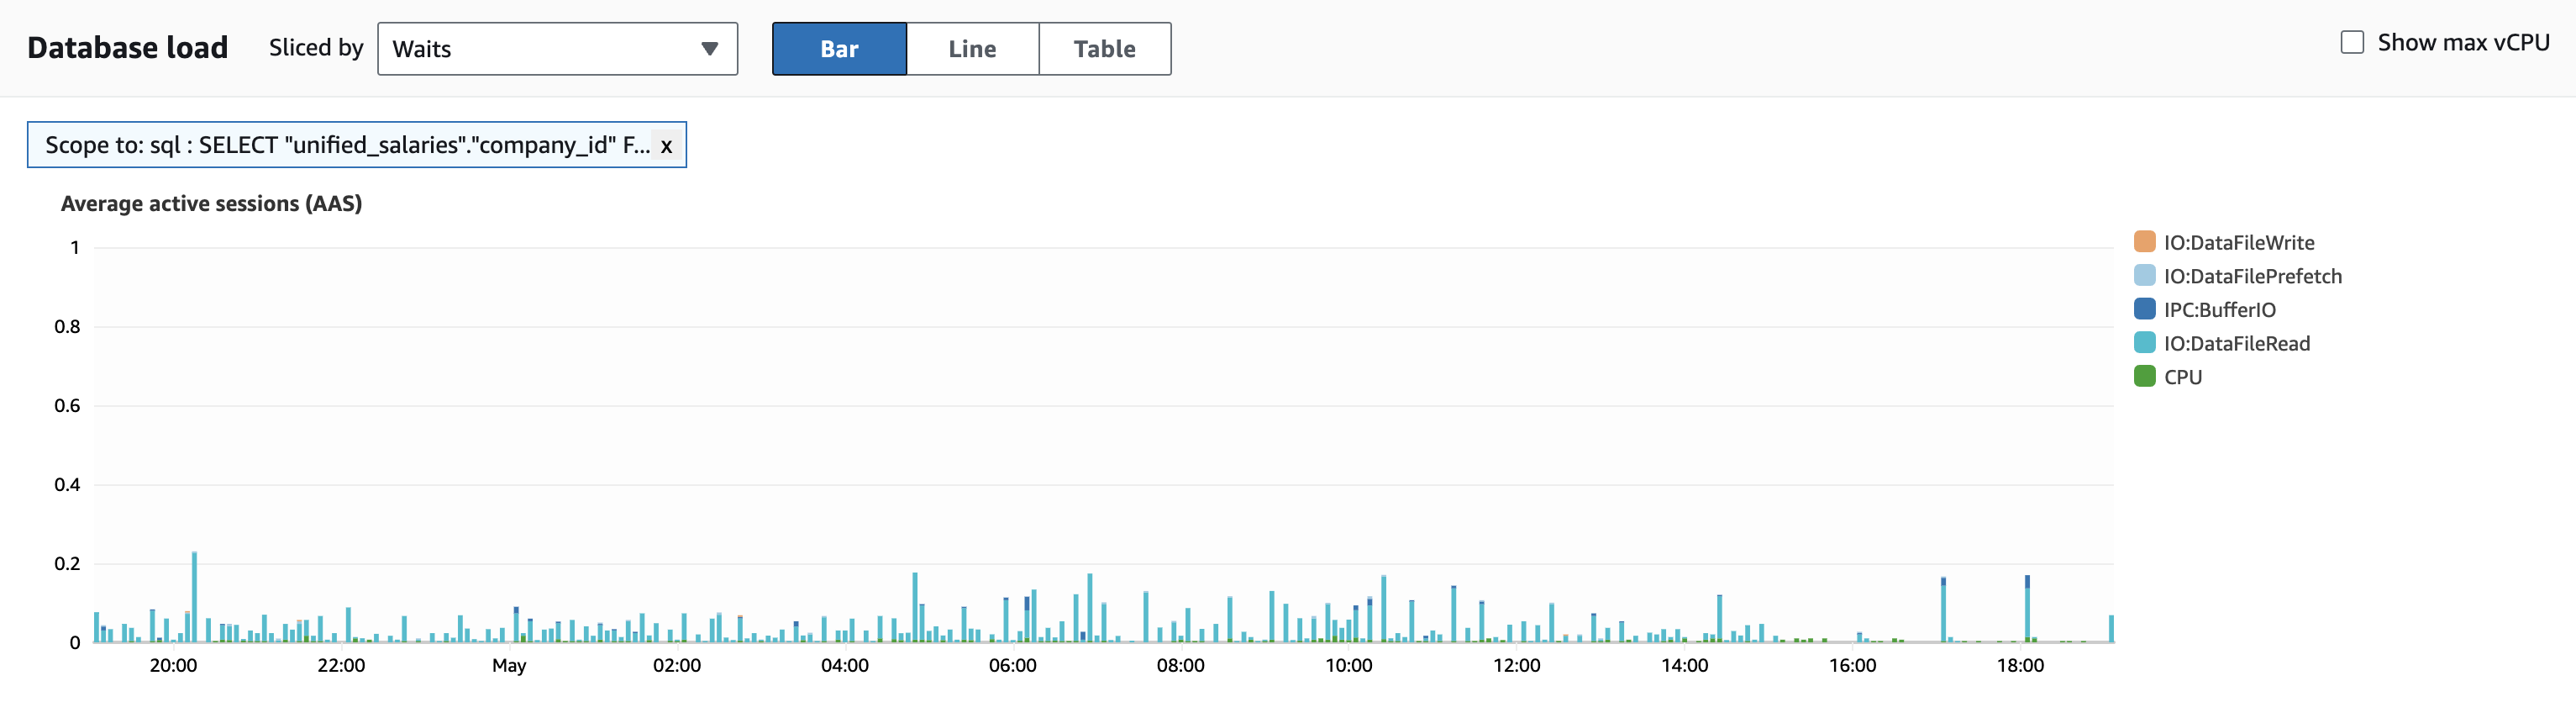
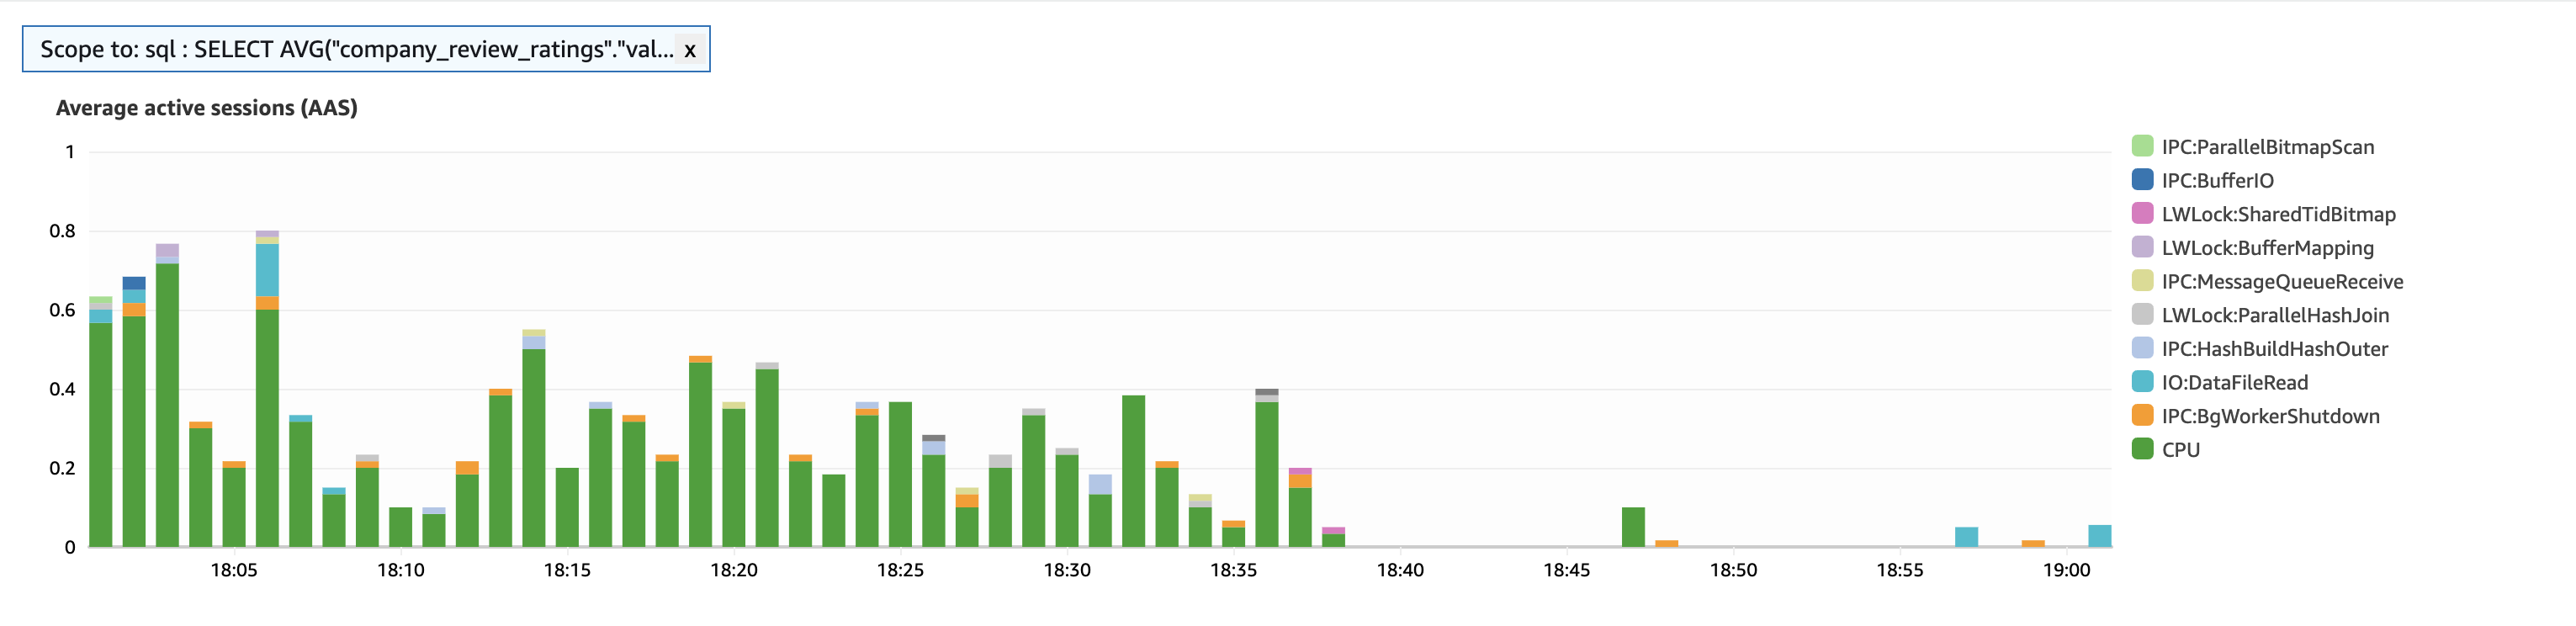
3️⃣ Caching Frequently Queries
We put the final touches on our performance boost by caching frequently accessed but rarely updated values. No need to hit the database every time.
With Ruby on Rails, we’ve got the power of low-level caching and Redis on our side. Fetching from Redis is lightning-fast compared to hitting Postgres. This tweak not only streamlined the process but also enhanced the UX significantly.
The result? We shaved off time from 0.7 to 0.4 seconds.
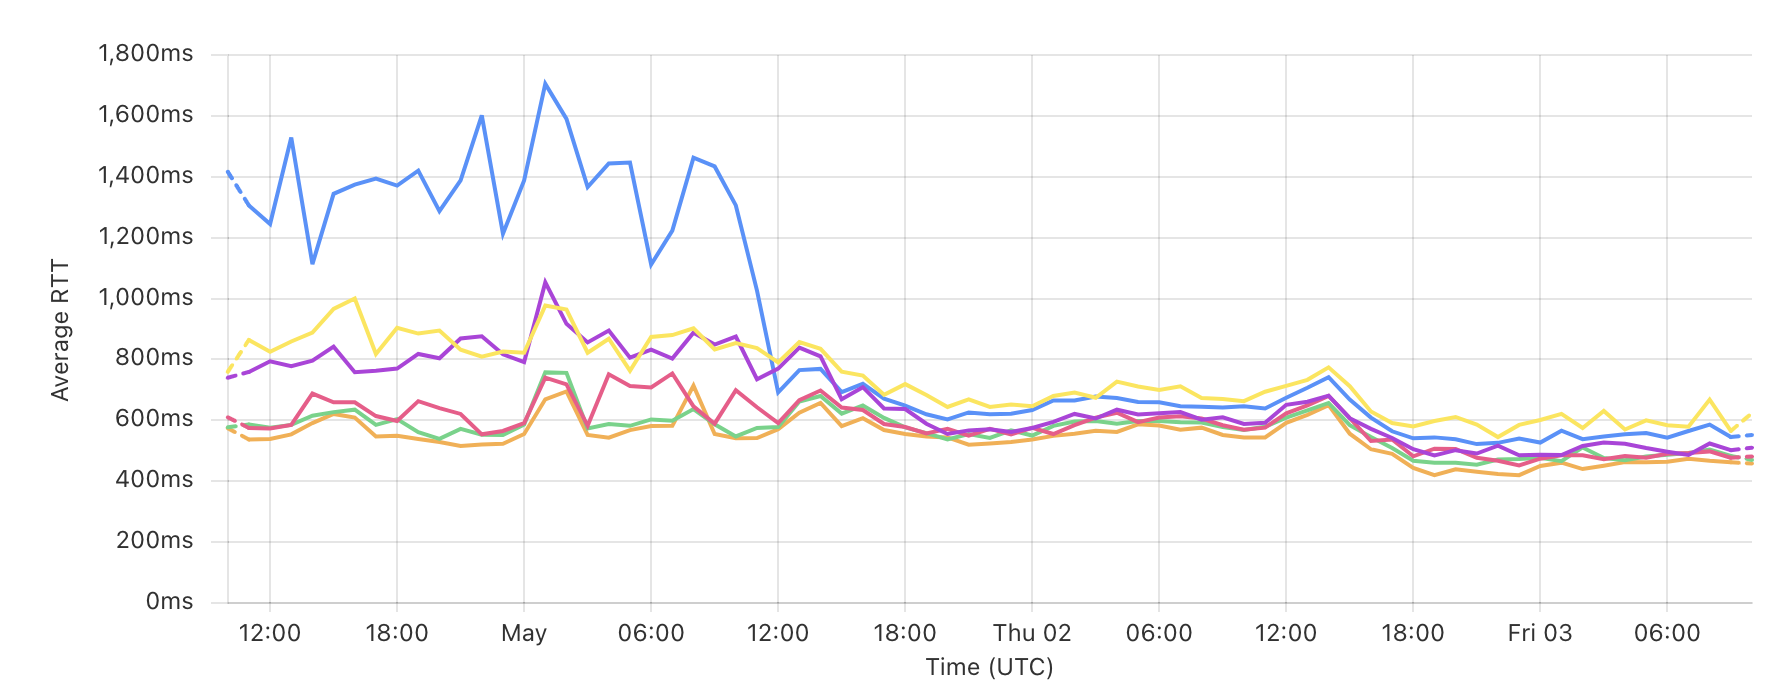
Wrapping Up: Efficiency Boosts at Lower Cost!
In just one day, we cut the average database load from 2.2 to 0.4 — talk about a 72% boost!
Here’s what that means:
We’ve slashed database latencies, giving users a smoother experience. Latencies for landing pages now reliably sit around 600ms, with dips to 400ms during quieter times (check out how we nailed it under 300ms by using using Cloudflare CF-IPCountry).
Even better, our database usage dropped by 8% instead of the feared 16% increase, despite a 30% jump in web sessions! That’s because we’re now using t4g DB instances, which only charge us when we go over the baseline (2vCPU in our case). Say goodbye to wasteful charges!